Facet Subplots of Number of Laps in Each Position for Each Driver in 2016 Formula 1 Season
It's been a slow week for the blog because it's been a busy week at work. I'm pleased to say that some of that work has involved putting my R skills to use in the "real world". It's amazing to me how much I've learned in such a short time. Muddling through datasets was definitely the way to go.
When last I was here, I promised an interactive version of my sunburst plot of soccer players with 100 or more caps. I was able to set up a Shiny app, but even though executing the app code in RStudio works just fine, I get an mysterious error message when I try to publish the app in my Shiny account. The non-sunburst elements appear (title, etc.), and the legend box appears briefly, but then it disappears and I'm left with this error message: invalid multibyte string at '<a0>Unite'. I searched the interwebs and reached out to a kind person on Twitter, but no solution is in sight. Very frustrating, but I'll keep at it. I couldn't make much sense of R when I first started, so I shouldn't expect my Shiny app to work first time I guess.
Busyness at work also means that I have not been able to put out the Week 8 USISSL table either. With Week 9 starting tonight, it doesn't make much sense to start working on it now.
Instead, with the Formula 1 Grand Prix in Russia this weekend, I thought I'd return to some F1 data. I have been wanting to try faceting a plot into multiple subplots, and I found this table of laps per position for the 2016 F1 season. I also found this exchange on Stack Overflow that provided an example of a way to facet these data. Here are the results:
And here's the business end of the code I used to do the faceting:
I'm reasonably happy with my first attempt at faceting. I was able to figure some general things out about labeling plots, too, which will be useful going forward. I'm also getting better at identifying superfluous code in the examples I rely on. Progress!
When last I was here, I promised an interactive version of my sunburst plot of soccer players with 100 or more caps. I was able to set up a Shiny app, but even though executing the app code in RStudio works just fine, I get an mysterious error message when I try to publish the app in my Shiny account. The non-sunburst elements appear (title, etc.), and the legend box appears briefly, but then it disappears and I'm left with this error message: invalid multibyte string at '<a0>Unite'. I searched the interwebs and reached out to a kind person on Twitter, but no solution is in sight. Very frustrating, but I'll keep at it. I couldn't make much sense of R when I first started, so I shouldn't expect my Shiny app to work first time I guess.
Busyness at work also means that I have not been able to put out the Week 8 USISSL table either. With Week 9 starting tonight, it doesn't make much sense to start working on it now.
Instead, with the Formula 1 Grand Prix in Russia this weekend, I thought I'd return to some F1 data. I have been wanting to try faceting a plot into multiple subplots, and I found this table of laps per position for the 2016 F1 season. I also found this exchange on Stack Overflow that provided an example of a way to facet these data. Here are the results:
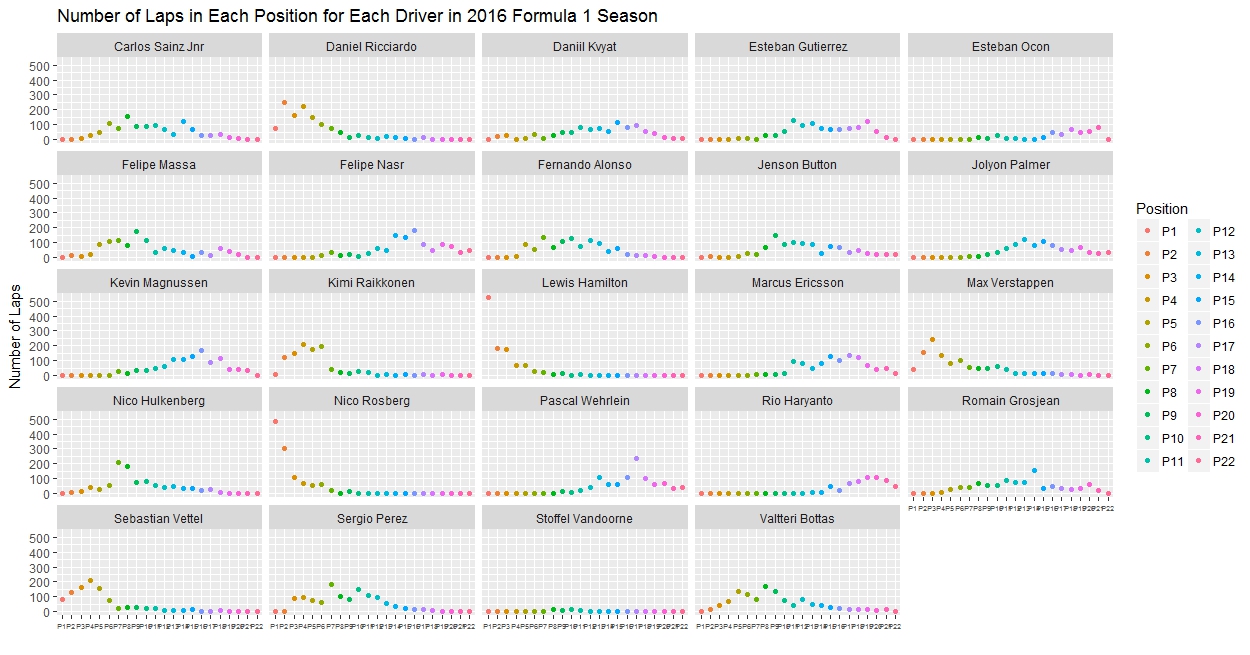 |
| (click to enlarge) |
And here's the business end of the code I used to do the faceting:
> ggplot(d, aes(Position,value, col=Position)) +
+   geom_point() +
+   facet_wrap(~driver)+
+   labs(y="Number of Laps",
+      title="Number of Laps in Each Position for Each Driver in 2016 Formula 1 Season", x="")+
+   theme(axis.text.x = element_text(size=5))
I'm reasonably happy with my first attempt at faceting. I was able to figure some general things out about labeling plots, too, which will be useful going forward. I'm also getting better at identifying superfluous code in the examples I rely on. Progress!

Comments
Post a Comment