IMPROVED Map of US Youth Soccer Registration and Current MLS Players by State
While troubleshooting some issues I'm having with a world map plot, I discovered a way to plot the rest of the Lower 48 onto my gradient shading map of MLS player production relative to US Youth Soccer registration numbers, the gory background details of which can be found here.
The trick to filling in the rest of the map but excluding it from the gradient shading is to add "all=TRUE" to the merge function statement that creates the data frame that is then used to create the map. Here are the pertinent lines of my code with that element added:
And here is the resulting improved map:
Much better! Now if only I could figure out what is wrong with my world map...
The trick to filling in the rest of the map but excluding it from the gradient shading is to add "all=TRUE" to the merge function statement that creates the data frame that is then used to create the map. Here are the pertinent lines of my code with that element added:
> statesTotal <- merge(all_states, stateMerged, by="region", all=TRUE)
> statesTotal$ratio<-as.numeric(statesTotal$ratio)
> statesTotal <- statesTotal[order(statesTotal$order),]
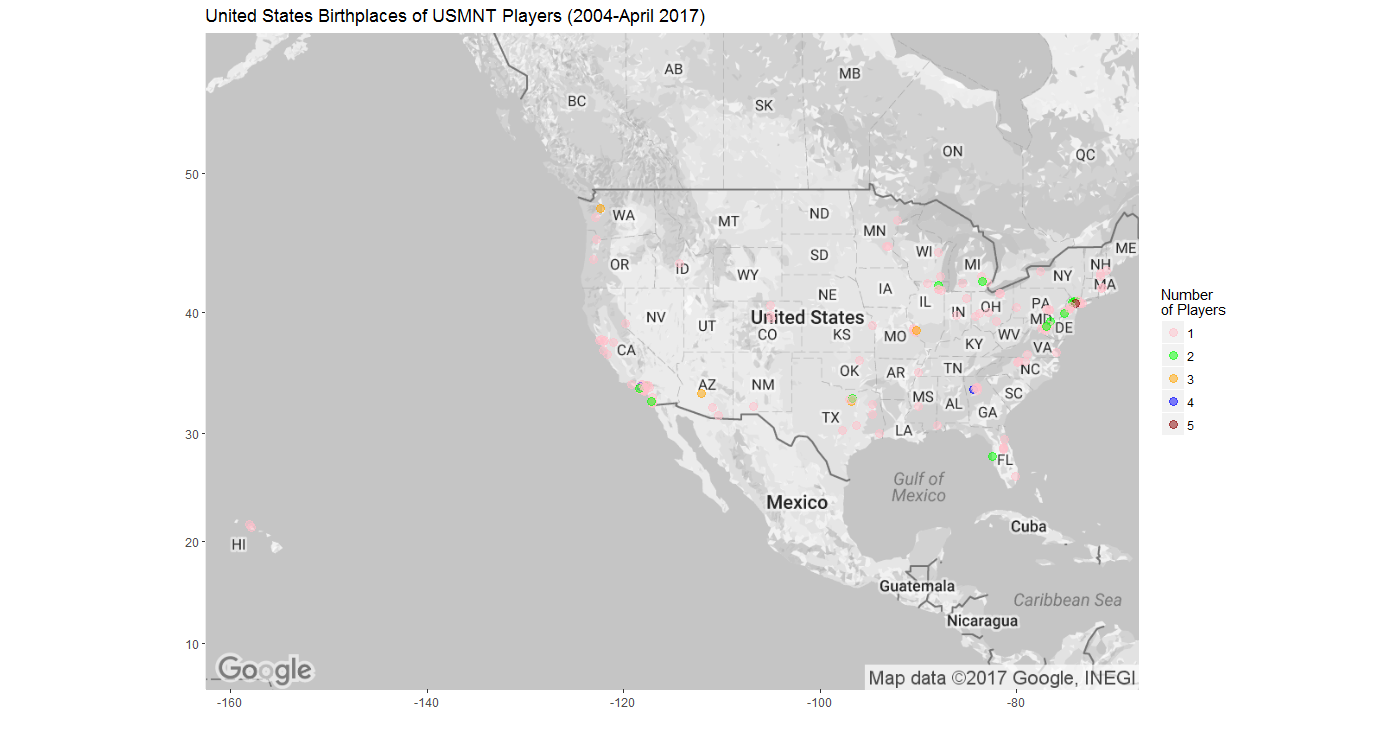
And here is the resulting improved map:
 |
| (click to enlarge) |
Much better! Now if only I could figure out what is wrong with my world map...

Comments
Post a Comment